 131 bugs fixed in pROC 1.20
I let AI agents loose on pROC for several days in October. They found 131 bugs in 1.19.1, plus 77 problems in its documentation and tests. I reviewed and revised everything. Below: how the hunt worked, how I checked it, what might break your code with the next update (1.20), and every fix with its commit.
AI disclaimer. The bugs were found, fixed and documented by AI agents (Claude Code, by Anthropic), working from my instructions with a large degree of autonomy. The review was also done with Claude, in a separate session: it audited the agents' work, reproduced the findings and prepared the decisions. Every decision about what to fix, and how, was mine, and I reviewed the results. This post was drafted by Claude from the agents' reports and the review records, and edited by me.
Breaking changes
These changes can break code that worked with 1.19.1:
geom_polygon_auc()has nolegacy.axesargument anymore: it follows the axes of theggroc()plot.- The formula methods of
plot.roc()andlines.roc()now takesubsetandna.actionafter..., so these must be named:plot.roc(y ~ x, data, subset = g == "a"). A positionalsubsetnow fails. - The unpaired DeLong test of
roc.test()no longer returns aparameter(df): it now compares its statistic to the normal distribution (Hanley & McNeil, 1983), like the paired DeLong and the bootstrap tests, instead of a Student t distribution with ad hoc degrees of freedom. p-values change slightly with small samples.
Results that change
Most fixes change results. Of the 131 bugs fixed, 55 change a
returned value (a wrong number, curve, confidence interval, p-value or
flag becomes right), 42 return a result where 1.19.1 failed with an
error, 11 fail with an error where 1.19.1 returned a wrong or
meaningless value, and 21 change only printed or plotted output. The
other two change where pROC writes its bug-report file, and add a
paired argument to cov() and
power.roc.test(). Every fix is listed below with its
commit.
What was done: the bug hunt
The hunt ran several days, mostly unattended.
The brief
I gave the agent a written brief:
- The deliverable: one draft pull request with one commit per bug.
- What counts as a bug: wrong results, inconsistencies between interfaces, ignored arguments, input handling, side effects, C++ problems, platform problems, wrong documentation and wrong tests.
- The methods to use: review against the literature, parameter sweeps, property tests, differential tests, edge cases, static analysis and sanitizers, coverage, and the history.
- The evidence: every bug needed a standalone reproducible example, with its output before and after the fix.
- Autonomy: the agent was not to stop and ask about individual bugs. Anything that changed behaviour or the API went to an approval queue instead. Nothing destructive was allowed: no force-push, no push to the main branches, no merge.
The organisation.
- The main session kept a ledger on disk with one
entry per bug, and ran the static checks itself: compiler warnings,
cppcheck,
codetools, lintr, coverage, and a sanitizer (ASAN/UBSAN) run of the whole test suite. - Hunter agents each searched one area: the
roccore; AUC, smoothing and multiclass; the CIs, bootstrap andcoords; DeLong, var/cov and the tests; power; plotting and printing; and the documentation. They couldn't touch git, and they ran R against a fixed copy of the package. - Fix agents worked in separate git worktrees. Each fix came with a regression test that had to fail before the fix and pass after it, and the full test suite ran on every commit.
Six passes
Each pass added new methods:
| Pass | Methods | Bugs found |
|---|---|---|
| 1 | The eight methods of the brief, on every area | 98 |
| 2 | Differential tests against brute force; features new in the development version | 9 |
| 3 | Other ROC packages as references; mutation testing (2574 mutants); real usage (all GitHub issues, Stack Overflow, the pROC calls of 216 reverse dependencies); papers; 8 older CRAN releases; the test suite on R 4.0–4.3 | 35 |
| 4 | Re-review of recent commits; deep dives where bugs clustered; the
tests of 162 reverse dependencies; plot output; every use of
...; unusual input types |
64 |
| 5 | Mutation testing of every line the pull request added (2219 mutants: no bug, the first method to find nothing); a crash fuzzer (about 20,000 generated programs) | 21 |
| 6 | Review of the latest commits; an extended fuzzer (40,000 programs); environment perturbation and a statistical calibration sweep, both cut short when we stopped the hunt | 5 |
The first method to find nothing was the mutation testing of pass 5.
Pass 6 still found bugs, but minor ones, such as a
plot.roc() option that ignored a partial AUC unless another
option was also set, a pairing rule that was not documented, and an
unclear error message. The hunt did not stop by itself.
During pass 6, the review session and I stopped it: read together, the
commits showed that in several places each point fix had widened the
previous one, and that needed rules before any more fixes ("Policies",
in the next section).
By the end, the hunt had produced 233 bug reports, from BUG-001 to BUG-233, in one pull request: #148.
How it was reviewed
First reviews, by the agent itself.
- Every candidate was re-run before it got a bug number.
- An adversarial review agent re-read all the commits before the first push. It found two regressions and four incomplete fixes, which were corrected before anything was published.
- GitHub's continuous integration ran on every push.
These reviews looked at one commit at a time, though. Several later fixes turned out to repair regressions introduced by earlier fixes of the same pull request.
Policies
With the hunt stopped, I set policies for the fixes:
- P1: degenerate input gives NA, as base R does;
- P2: no matching on warning messages, and no blanket suppression of warnings;
- P3: no floating-point tolerances as fixes;
- P4: fix in one place;
- P5: test hygiene;
- P6: classes from packages pROC doesn't depend on are out of scope;
- P7: every statistical change needs a source that was actually read.
Root causes
For each cluster of related fixes, the agent wrote a design note, and I decided how to fix the cause once: argument routing, smoothing settings, rounding, input normalisation, degenerate input, and the bootstrap. The agent then rewrote the history so that each commit holds one complete, reviewed fix.
An audit of the whole pull request
A second agent:
- checked every commit against the policies;
- compared the behaviour of the whole package with 1.19.1;
- loaded objects saved by 1.19.1 into the new version;
- compared performance with 1.19.1;
- measured every test that depends on a random seed over hundreds of seeds.
I took each finding as a separate decision.
A check that every bug was reviewed
Some fixes had only been accepted as a number in a list. So every bug was traced back to the evidence I had actually seen:
- the 15 fixes that change numbers, or turn a value into an error, were reviewed again in full: all 15 were real bugs, and a few needed changes;
- the other 117 got a lighter pass, with each fix re-run against 1.19.1.
Final check
After the last revision, 1520 test cases were compared between 1.19.1, the previous version of the pull request and the final one. Every difference traced back to a documented decision.
Other fixes
A few bugs were also fixed in the development version, separately from the hunt: seven bugs and two warning or error messages (DEV-1 to DEV-10). They are included in the counts and in the lists below.
Not fixed
5 bugs of 1.19.1 are not fixed, by decision:
- three floating-point rounding cases (BUG-112, the weighted ties of BUG-113, and the fraction case of BUG-226): no floating-point tolerance as a fix;
- integer64 predictors (BUG-174): a class from a package pROC doesn't depend on;
- a single density value (BUG-205): degenerate input, which returns a value as in 1.19.1.
Lessons learned
- Settle the policies before the first fix, not after 230. I only wrote P1 to P7 once the commits were already contradicting each other. By then the agent had made statistical claims from memory instead of checking them (P7), and was introducing tolerances in numeric comparisons everywhere (P3). But how do you know what policies are needed beforehand?
- When a third fix lands in the same function, it's time to take a step back. Reviewing commit by commit didn't catch the clusters. Reviewing by root cause did.
- Record who decided what. Once, the review agent put into the agent's brief a decision I had never made. Now every decision file quotes my answer, and anything else is labelled a proposal.
- Freeze history before writing about it. The branch was rewritten three times during the review, and every commit hash in the decision files and the pull request had to be updated each time.
All the changes
Each entry links to its commit, with a reproducible example and the output before and after the fix.
Bugs fixed (131)
| Bug | Area | Fix | Commit |
|---|---|---|---|
| BUG-001 | roc.test/cov/var | roc.test: the paired DeLong conf.int was on the 0-1 scale for percent=TRUE curves | 4664e42 |
| BUG-002 | roc.test/cov/var | roc.test: conf.level unchecked with the automatic method (NaN or inverted CI) | 7563cd6 |
| BUG-003 | roc.test/cov/var | roc.test/cov: the partial AUC of auc objects of smoothed curves was ignored | b511a3d |
| BUG-004 | roc.test/cov/var | roc.test/cov/var: numeric-density smoothed curves gave D=Inf or 0 instead of the documented error | 5b8a819 |
| BUG-005 | roc.test/cov/var | roc.test: unpaired Venkatraman mixing proportion used n1+n1 instead of n1+n2 | ba1d471 |
| BUG-006 | roc.test/cov/var | cov: Obuchowski method returned NaN for percent curves with a partial AUC | dd976e2 |
| BUG-008 | roc.test/cov/var | roc.test: paired Venkatraman p-value depended on the row order with ties | 8822bcc |
| BUG-011 | roc.test/cov/var | cov: paired curves with NAs at different positions failed or gave a wrong bootstrap value | b2718f5 |
| BUG-013 | roc.test/cov/var | roc.test/cov: a partial AUC on roc2 only picked DeLong and crashed (wrote pROC_bug.RData) | 6adb5a3 |
| BUG-014 | roc.test/cov/var | roc.test: Venkatraman ran on whole curves when only roc2 had a partial AUC | 96194dd |
| BUG-016 | roc.test/cov/var | roc.test/cov: formula-built curves were not seen as paired with default-built ones | b5f4619 |
| BUG-017 | roc | roc/auc/ci* (formula): subset failed ("object not found") with plot=TRUE or smooth=TRUE | aac4e69 |
| BUG-018 | roc | roc (formula, data.frame), roc_: malformed list instead of NA/NaN with NA data | 3a34186 |
| BUG-019 | roc | roc (densities): direction="auto" was not resolved with auc=FALSE (inverted curve) | ef34a6c |
| BUG-020 | roc.test/cov/var | are.paired: user objects named oroc1/oroc2 broke roc.test and cov | e784d77 |
| BUG-021 | roc.test/cov/var | are.paired(return.paired.rocs=TRUE): unsmoothed curves returned for smoothed input | 8f1ccd0 |
| BUG-022 | auc | has.partial.auc: TRUE for a malformed partial.auc of length 1 | 87507b2 |
| BUG-025 | coords | coords: an NA threshold (input="threshold") failed instead of giving an NA row | ae37c68 |
| BUG-026 | roc | roc: na.action attribute lost when some responses were outside levels | fb7b51a |
| BUG-029 | roc | roc(smooth=TRUE) via formula/data.frame: data names printed as "(unknown)" | 5f7115e |
| BUG-030 | roc | roc_: failed when called from a function through Map or mapply | bf40bd1 |
| BUG-031 | multiclass | multiclass.roc: error when exactly half the classes had no predictor column | 4517c60 |
| BUG-032 | smooth | smooth: logcondens smoothing ignored direction=">" | ae03636 |
| BUG-033 | smooth | smooth(reuse.ci=TRUE): failed on every curve with a stored CI | 97ae00f |
| BUG-035 | auc | auc: partial.auc bounds outside [0, 1] returned NA or empty AUC instead of an error | c0e0006 |
| BUG-036 | smooth | smooth(method="fitdistr"): curve truncated to the data range (AUC off by up to 0.27) | f3787d8 |
| BUG-037 | multiclass | multiclass.roc: requested levels without observations failed for non-factor responses | e9c1d73 |
| BUG-040 | smooth | smooth (binormal): points sharing one specificity ran backwards or failed | bd0aa83, 36092b8 |
| BUG-041 | multiclass | multiclass.roc: a tibble predictor matrix failed ("Predictor must be numeric or ordered") | f64f87e |
| BUG-042 | smooth | roc(smooth=TRUE, fitdistr): "unused argument" with the partial AUC arguments | a2a71f5 |
| BUG-043 | multiclass | multiclass.roc: fewer than two usable levels gave AUC=Inf instead of an error | eb399cf |
| BUG-044 | coords | coords(x="best"): wrong youden/closest.topleft with a specificity partial AUC | c5b94e2 |
| BUG-045 | coords | coords: fpr, fnr and other complementary inputs picked the wrong end of flat segments | 28487a4 |
| BUG-046 | coords | coords: NA threshold for exact points with numeric inputs other than se/sp | 4aed903 |
| BUG-047 | coords | coords on an auc object: ignored all arguments and returned the whole curve | 0336680 |
| BUG-048 | ci | ci.auc: NA CI for smoothed percent curves with a corrected partial AUC | fb4b263 |
| BUG-049 | ci | ci.coords (smoothed): replicates shifted when some resamples failed to smooth | d87f992 |
| BUG-050 | ci | ci.coords(x="best"): failed when a resample had no point in the partial AUC range | 77ec97c |
| BUG-051 | ci | ci/ci.* (formula, default): smooth=TRUE failed | 10f5350 |
| BUG-052 | ci | ci.se/sp/coords/thresholds: non-stratified resamples losing a class aborted | 6c3051a |
| BUG-057 | coords | coords(x="best"): closest.topleft 100 times too large on percent curves | c5b94e2 |
| BUG-058 | power.roc.test | power.roc.test: paired curves with NAs at different positions failed or misaligned | e94449d |
| BUG-059 | power.roc.test | power.roc.test: NaN for the auc of a percent curve | 3b13115 |
| BUG-060 | power.roc.test | var/cov/power.roc.test (Obuchowski): binormal A/B misused, pAUC variances far too small | fefccc6 |
| BUG-061 | power.roc.test | power.roc.test (Obuchowski): null variance used the alternative's parameters | fba063e |
| BUG-061b | power.roc.test | power.roc.test (DeLong, bootstrap): result depended on curve order, NaN if better first | 31de1a4 |
| BUG-062 | power.roc.test | power.roc.test (two curves): kappa ignored in the variances | 25f4144 |
| BUG-063 | power.roc.test | power.roc.test (one curve): a partial AUC was silently replaced by the full AUC | baf6209 |
| BUG-064 | power.roc.test | power.roc.test (parameter list): FPR bound order flipped the covariance (107 vs 205) | ffe2ac2 |
| BUG-065 | power.roc.test | power.roc.test (bootstrap): variances from the wrong margin, random sample sizes | 0abf5cc |
| BUG-066 | roc.test/cov/var | var: failed on smoothed curves built with percent=TRUE | 7eedc33 |
| BUG-067 | smooth | print (fitdistr-smoothed curve): fitted distributions never shown | 2cc6e4d |
| BUG-068 | auc | Ops on auc/ci: unary minus failed; auc + ci returned a ci with a warning | 74f2b2b |
| BUG-069 | multiclass | print (multivariate multiclass.roc, formula): predictor names pasted together | 5ba7ee0 |
| BUG-070 | roc | print (roc from densities): garbage "Data: (unknown) in 0 controls" line | 3a8cb55 |
| BUG-071 | ggroc | ggroc: partially named lists gave blank labels or "Names must be unique" | 66ad4ca |
| BUG-072 | plot | plot.roc/lines.roc (formula): returned curve printed "(unknown)" names | 87d85ad |
| BUG-074 | ggroc | geom_polygon_auc: default fill (dark grey) unlike plot.roc's gainsboro polygon | a5ad49b |
| BUG-075 | plot | plot.ci.coords: zero-width ticks for a single x; cryptic error for x="best" | 7d16372 |
| BUG-076 | roc | roc(ci=TRUE, of="coords", x=..., plot=TRUE): x reached plot.roc and failed | 552a364 |
| BUG-090 | roc | roc (densities): direction="auto" with a corrected pAUC failed below the diagonal | 3509a28 |
| BUG-091 | roc.test/cov/var | roc.test (sensitivity/specificity methods): reported the AUCs as estimates | c622f4a |
| BUG-095 | roc.test/cov/var | roc.test: the documented data.name element was missing | 9100cb8 |
| BUG-097 | coords | coords (smoothed): transpose, drop and as.list gave the wrong shape | d03dce3 |
| BUG-098 | smooth | smooth(method="fitdistr", density="t"): always failed | ccfe199 |
| BUG-099 | ci | ci.auc/var: non-stratified bootstrap aborted when a resample lost the controls | 27d3914 |
| BUG-106 | coords | coords/ci.*: percent rates not exact (typed 57.5 missed points); "best" lost exact ties | 72fc41b, 42b3d2f |
| BUG-107 | coords | coords("local maximas"): flat edges, straight segments and dents reported | 3c4920f |
| BUG-108 | roc.test/cov/var | roc.test: data.name garbled for long calls | bfa969c |
| BUG-114 | roc.test/cov/var | roc.test: the unpaired Venkatraman statistic was not integrated over [0, 1] | 5472f25 |
| BUG-115 | smooth | smooth(fitdistr, density function): an extra ... argument failed ("unused argument") | c091aa1 |
| BUG-116 | roc.test/cov/var | roc.test (se/sp methods): D=NaN when the tested values never differ | a2f9d33 |
| BUG-117 | smooth | smooth(fitdistr, discrete densities): pmf evaluated between integers, wrong curve | b9e15e8 |
| BUG-117b | smooth | smooth(fitdistr): density names in another case ("Normal") rejected, unlike MASS | e65b358 |
| BUG-119 | roc.test/cov/var | roc.test (one-sided paired DeLong): returned the two-sided conf.int | 13e735a |
| BUG-120 | other | internal errors: pROC_bug.RData written to the working directory without asking | 9c3b658 |
| BUG-121 | roc.test/cov/var | roc.test (paired DeLong): single case/control crashed or gave p=1 instead of NA | dc52829 |
| BUG-122 | auc | auc/ci* (response, predictor): failed instead of returning roc()'s NA/NaN | 6813bdc |
| BUG-133 | smooth | ci.coords/roc(smooth.method="density"): x of ci.coords passed to density() | a2a71f5 |
| BUG-140 | roc.test/cov/var | roc.test: unpaired Venkatraman permuted raw ranks, not the mixture CDF scale | 55238cb |
| BUG-141 | ci | ci.se/ci.sp (smoothed): "dim(X)" error when no resample could be smoothed | b621cfa |
| BUG-144 | roc.test/cov/var | roc.test/multiclass.roc (formula): subset failed with plot=TRUE or smooth=TRUE | aac4e69 |
| BUG-146 | roc.test/cov/var | roc.test (unpaired DeLong): D=NaN for two curves with zero variance | e6e02b2 |
| BUG-151 | multiclass | print (multiclass.roc from a formula in a variable): failed | 43c569d |
| BUG-156 | plot | plot.roc(print.thres): percent curves showed thresholds with 1 decimal | 9646da2 |
| BUG-157 | plot | plot.ci/plot.roc(ci.type="shape"): shapes crossed for unordered CI points | bbf2933 |
| BUG-158 | plot | plot.roc(print.auc, new partial.auc): printed the stored full AUC's CI | 34d40a9 |
| BUG-159 | plot | plot.roc(legacy.axes=TRUE, percent): axis labels padded and off-centre | 050b5d0 |
| BUG-160 | plot | plot.roc: ci.coords CIs drawn on wrong axes, or failing for x="best" | f049d8f |
| BUG-161 | plot | plot.roc/roc(smooth=TRUE): panel.first/panel.last evaluated before the plot | a2a71f5 |
| BUG-162 | plot | plot.roc/lines.roc (default, smooth=TRUE): curve printed internal names | a4faf0a |
| BUG-163 | plot | plot.roc(print.thres="all", pAUC): window limits marked and labelled "NA" | 74aba20 |
| BUG-164 | plot | plot.roc/lines.roc (formula): sub= taken as subset; subset must now be named | aac4e69 |
| BUG-165 | ci | ci.auc/ci (smooth=TRUE): failed with reuse.auc=FALSE or auc=FALSE | 552a364 |
| BUG-166 | ci | ci/ci.auc (response, predictor, smooth=TRUE): 'method' collided with smooth.roc | a2a71f5 |
| BUG-167 | multiclass | multiclass.roc: ci/auc arguments failed ("matched by multiple arguments") | 552a364 |
| BUG-168 | smooth | roc(smooth=TRUE, plot=TRUE, main=quote(...)): CI all NA, roc.test failed | 24da24c |
| BUG-169 | smooth | roc(smooth=TRUE, density, plot=TRUE): graphical adj changed the curve or failed | a2a71f5 |
| BUG-170 | plot | plot.roc: graphical parameter lab failed | 552a364 |
| BUG-171 | plot | plot.roc(print.auc/print.thres/polygons): cex, pch, adj... failed | 552a364 |
| BUG-172 | smooth | roc(smooth=TRUE, fitdistr, density=<function>): density name recorded wrong | b9e095f |
| BUG-173 | roc | roc (ordered, numeric labels): observations of an NA level dropped | 0f43659 |
| BUG-175 | roc | roc/multiclass.roc: duplicated levels compared a class with itself | 803c146 |
| BUG-176 | roc.test/cov/var | are.paired/roc.test: explicit levels=c(0, 1) made paired curves unpaired | f7f04de |
| BUG-177 | roc | roc/smooth (densities): negative density values gave a wrong AUC | cab602e |
| BUG-191 | roc.test/cov/var | ci.auc/var/cov/power.roc.test: a percent curve with a stored ci.coords failed | dd976e2 |
| BUG-192 | ci | ci.coords (smoothed): all-NA threshold column; ret="threshold" alone now errors | f4ec873 |
| BUG-193 | coords | coords (smoothed, numeric x): best.weights ignored for youden/closest.topleft | 3be234f |
| BUG-195 | coords | coords/ci.*: NA in x, specificities, sensitivities or thresholds failed | ae37c68 |
| BUG-196 | ci | print (ci.coords with repeated x): "duplicate row.names" error | d1fd14d |
| BUG-198 | coords | coords/ci.coords/plot.roc: negative cost in best.weights gave the worst threshold | abd5536 |
| BUG-201 | roc.test/cov/var | roc.test/are.paired: re-paired curves printed pROC internals | 7822db2 |
| BUG-202 | ci | boot.n: fractions/NA unchecked; Venkatraman p divided by a fractional boot.n | 41a8df6 |
| BUG-203 | ci | ci*/roc.test/power.roc.test: vector or NA conf.level, kappa... gave garbled results | debd4d0 |
| BUG-204 | auc | auc: partial.auc.correct=1 mislabelled; integer bounds warned in roc.test/cov | 55edcaf |
| BUG-213 | ci | ci.coords(ret="all", non-threshold input): failed instead of skipping threshold | 57cde0e |
| BUG-218 | ci | are.paired/smooth(reuse.ci=TRUE): stored "best" ci.coords recomputed with Youden | e67489e |
| BUG-223 | ci | ci.thresholds("all", pAUC): quantile() error from window-limit points | 24724b5 |
| BUG-224 | coords | coords("best")/plot.roc(print.thres): pAUC window without points failed | 6558c2e |
| BUG-230 | plot | plot.roc(print.thres, partial.auc, reuse.auc=FALSE): best ignored the pAUC | d0ae66e |
| BUG-231 | ci | ci.coords (count input, non-stratified): failed when a resample had too few | a0c465b |
| BUG-232 | roc.test/cov/var | cov/power.roc.test: no 'paired' override; roc.test(paired=FALSE) warned | e9fe809 |
| BUG-234 | roc.test/cov/var | roc.test/cov (bootstrap): extra smoothing argument failed, wrote pROC_bug.RData | 24da24c |
| DEV-1 (develop) | ci | ci.coords: fractions instead of percentages on percent=TRUE curves | bbf2270 |
| DEV-2 (develop) | roc.test/cov/var | cov/roc.test (bootstrap): an NA replicate dropped a whole curve's values | bbf2270 |
| DEV-3 (develop) | ci | ci.coords (smoothed): failed for every x unless input was given, always for "best" | be0d834 |
| DEV-4 (develop) | power.roc.test | power.roc.test: two partial AUC curves failed instead of using the bootstrap | 152c499 |
| DEV-5 (develop) | ggroc | ggroc: a mixed list of roc and smooth.roc curves failed | 6072b2b |
| DEV-6 (develop) | plot | plot.roc(print.auc=TRUE) on a curve with a CI: AUC label drawn twice | b2f09c4 |
| DEV-8 (develop) | ci | ci.coords(best.policy="omit"): resamples with several best points put thresholds in the rate columns | 9afd18f |
Documentation and tests (77)
| Bug | Area | Fix | Commit |
|---|---|---|---|
| BUG-007 | roc.test/cov/var | ?roc.test: wrong method list, one-sided Venkatraman behaviour and return values | 15107f5 |
| BUG-009 | roc.test/cov/var | ?var/?cov: documented a bootstrap fallback where the code errors; obuchowski unlisted | 1d650b8 |
| BUG-010 | roc.test/cov/var | var: Obuchowski errors said "Using bootstrap instead" though nothing ran | 1d650b8 |
| BUG-012 | roc.test/cov/var | roc.test: an explicit predictor2 = NULL gave an unrelated error | f4039ed |
| BUG-015 | roc.test/cov/var | ?roc.test: conf.level range described as excluding 0 and 1 | 703175d |
| BUG-023 | roc | roc: the deprecated 'algorithm' warning showed a literal %s | aee1c06 |
| BUG-024 | roc | roc (formula): cryptic stopifnot error for formulas without response or with odd terms | 9b5f3e3 |
| BUG-027 | roc | ?roc: said combined input sets were ignored (they give an error) | 767e7a6 |
| BUG-028 | roc | roc: the density error named response/predictor instead of cases/controls | 3f2f0d9 |
| BUG-034 | other | pROC: partial matching of list elements warned with warnPartialMatchDollar | 70c22fa |
| BUG-038 | multiclass | multiclass.roc: false "classes not found" warning with a subset of levels | 5e95a52 |
| BUG-039 | multiclass | ?multiclass.roc/?auc: wrong value description and smoothing docs | e98d1db |
| BUG-053 | ci | ?ci.auc: documented a warning and fallback for DeLong partial AUC (it errors) | 6eb2944 |
| BUG-054 | coords | ?coords: ignore.partial.auc description reversed | 1fdcb96 |
| BUG-055 | other | ?ci and others: claimed char/style were passed to txtProgressBar | fc65cae |
| BUG-073 | ggroc | geom_polygon_auc: "no applicable method" on a curve without AUC | 4f5d7f3 |
| BUG-077 | other | Help pages: wrong volume (7, not 12) of the pROC paper | 607b7c7 |
| BUG-078 | ci | ?ci.auc: the partial AUC example computed the full-AUC CI | ddbaf52 |
| BUG-079 | roc | ?roc: example claimed smooth(roc()) has no AUC | e81dfbd |
| BUG-080 | ci | ?ci.coords: wrong class and a broken link in the value section | 051a08f |
| BUG-081 | coords | ?coords: wrong sign in the closest.topleft formula | 46219a2 |
| BUG-082 | coords | ?coords_transpose: wrong 1.16 default and deprecation conditions | bb74e6b |
| BUG-083 | roc.test/cov/var | ?cov: wrong bootstrap covariance formula, replicate shape and example | 4610f1a |
| BUG-084 | plot | ?plot.roc: the example built roc.ndka from wfns | d9b8fbb |
| BUG-086 | other | ?pROC: wrong number of aSAH patients (141, not 113) | 382237c |
| BUG-087 | other | FAQ vignette: stale and incorrect statements | de17f58 |
| BUG-088a | other | ?groupGeneric: aliases of nonexistent Ops/Math methods | 2d7286e |
| BUG-088b | ci | ?ci.auc: the middle value was called the median for every method | 9ff1d45 |
| BUG-088c | ci | ?ci.auc/?cov/?var: copy-pasted roc.test references | 9151604 |
| BUG-088d | ci | ?ci.auc: duplicated usage line | f3ed0ee |
| BUG-088e | other | Help pages: cited the plyr paper, no longer used | 39ac7ae |
| BUG-088f | plot | ?lines.roc: wrong x argument names and return value | 6cf69a9 |
| BUG-088g | plot | ?plot.ci: type="shape" did not mention ci.coords | c2d0183 |
| BUG-088h | smooth | ?smooth: quoted a missing-package error pROC never gives | 9226d5d |
| BUG-088i | smooth | ?smooth: incomplete description of 'start' | 81c0de3 |
| BUG-088j | smooth | ?smooth: percent and direction said to come from arguments, not the curve | bda5ddf |
| BUG-088l | other | ?aSAH: one laboratory variable instead of two | fcd27fa |
| BUG-088m | other | ?aSAH: example comment named a nonexistent 'set' variable | 75c269e |
| BUG-088o | auc | ?auc: wrong destination of auc.smooth.roc's ... | 65959d0 |
| BUG-088p | roc.test/cov/var | ?roc.test: wrong unpaired DeLong statistic formula | a5f7778 |
| BUG-088r | other | Help pages: spelling mistakes, including in cited references | 30c8670 |
| BUG-089 | multiclass | ci.se: multiclass error message named ci.sp | ba4000a |
| BUG-092 | coords | coords (smoothed): each deprecation warning given two or three times | d03dce3 |
| BUG-093 | roc | ?roc: said na.rm is ignored by roc.formula | bcf6e97 |
| BUG-094 | coords | tests: the coords se/sp range test never used its smoothed percent curve | 5c9e145 |
| BUG-104 | plot | plot.roc(ci=TRUE) on a curve without CI: cryptic "need finite 'xlim'" error | ae078fa |
| BUG-111 | coords | ?coords: did not say "local maximas" is unavailable on smoothed curves | f1673ea |
| BUG-125 | ggroc | ggroc: partial argument match warning ('lim') with warnPartialMatchArgs | 503079c |
| BUG-127 | roc | ?roc: how direction="auto" is chosen was never described | ef34a6c |
| BUG-128 | roc.test/cov/var | ?roc.test/?cov: re-pairing of curves on common observations undocumented | ea0a6e3 |
| BUG-130 | roc | roc/auc/ci* (response, predictor): cryptic error for a data.frame response | 162d392 |
| BUG-131 | roc.test/cov/var | ?roc.test: misleading description of na.rm = FALSE | e20cabf |
| BUG-134 | roc | ?roc: wrong names of the arguments roc() forwards | 4b3b201 |
| BUG-136 | multiclass | ci* (multivariate multiclass): misleading "No valid data provided" error | a2c1682 |
| BUG-137 | roc | ?roc: did not say ci.coords' ret cannot go through roc_ | d2a918e |
| BUG-138 | other | ?smooth/?roc.test: wrong Zou, Rufibach and Pepe references | 14460c6 |
| BUG-139 | multiclass | ?multiclass.roc/?auc: univariate AUC wrongly attributed to Hand and Till | 3aeb7f2 |
| BUG-147 | multiclass | multiclass.roc: cryptic error for a data.frame response | 162d392 |
| BUG-148 | multiclass | multiclass.roc(smooth=TRUE): cryptic "$ operator" error | 552a364 |
| BUG-149 | ci | var/ci.se/ci.sp/ci.coords (smoothed, corrected pAUC): a warning per replicate | 0de1e67 |
| BUG-152 | multiclass | ?multiclass.roc: levels field wrong, rocs field undocumented (code part reverted) | bd24db6 |
| BUG-154 | smooth | smooth(fitdistr, logcondens): cryptic optim/logcondens errors for a single-value class | ec0b962 |
| BUG-155 | power.roc.test | power.roc.test: errors asked for an 'auc' that was given or not accepted | 85b253c |
| BUG-166b | ci | ci.auc (smoothed curve): method="delong" silently ignored (now warns) | ae4327a |
| BUG-181 | roc | ?roc: said na.action is not supported by the formula method | aac4e69 |
| BUG-184 | roc.test/cov/var | ?roc.test: wrong per-method details (boot.n, estimates, warnings) | e568f7e |
| BUG-187 | plot | ?plot.roc: x and value said "roc" only, not smooth.roc | ae078fa |
| BUG-188 | ci | ?ci.se/?ci.sp: quoted a density error that doesn't exist | 8e96fc6 |
| BUG-197 | coords | coords/ci.coords: misspelt ret elements silently dropped (now warns) | 090b467 |
| BUG-207 | multiclass | auc (multiclass): each pairwise warning emitted twice | 2765331 |
| BUG-221 | smooth | ?smooth: 'start' documented as optional where fitdistr requires it | cc977b6 |
| BUG-222 | smooth | smooth(fitdistr): a fixed parameter of a closed-form density gave a cryptic error | ec0b962 |
| BUG-227 | other | coords/roc warnings: typos "cased by" and "values(s)" | d7fd7b4 |
| BUG-233 | multiclass | multiclass.roc: misleading error when only one matrix column matched | 2396fd1 |
| BUG-235 | roc.test/cov/var | roc.test: curves it returned warned "Different smoothing parameters" when reused | 24da24c |
| DEV-7 (develop) | plot | plot.ci.*: low-level "plot.new has not been called" error with no plot open | 4e084c3 |
| DEV-9 (develop) | other | parallel: the documented deprecation warning was never given | c332ddf |
| DEV-10 (develop) | roc.test/cov/var | var and cov with method = "obuchowski" ignored partial.auc.correct | f4d568e |
Xavier Robin
Published Monday, November 2, 2026 10:36 CET
Permalink: /blog/2026/11/02/130-bugs-fixed-in-proc-1.20
Tags:
pROC
Comments: 0
Breaking changes for ordered predictors in upcoming pROC 1.20.0
pROC has always accepted ordered factors as predictors (for example aSAH$wfns,
the WFNS neurological grade in the aSAH dataset, with levels 1 to 5).
Internally it simply called as.numeric() on them and computed thresholds as the midpoints
between consecutive numeric codes (1.5, 2.5, and so on).
That's reasonable when the levels happen to be the numbers 1:n, but it is
not appropriate for an ordered factor whose levels are textual, for example "very low",
"low", "medium", "high", "very high". The thresholds
were still -Inf, 1.5, 2.5, 3.5, 4.5, Inf, numbers that do not correspond to anything in
the data and are meaningless to show. This was reported as
issue #63, and a fix for it was just merged into
the develop branch.
In practice, this could potentially break some of your code. Before it reaches CRAN, I'd like testers
who use ordered predictors to try the develop version on their own data and tell me if
anything looks wrong.
What changes
On develop, thresholds of an ordered ROC curve are now the predictor's own levels, plus
one infinite sentinel for the all-positive or all-negative cut-off. Sensitivities, specificities
and AUC are exactly the same as before, only the threshold labels change, from numeric
midpoints to the levels you actually gave it:
library(pROC)
data(aSAH)

wfns.txt <- aSAH$wfns
levels(wfns.txt) <- c("very low", "low", "medium", "high", "very high")

r <- roc(aSAH$outcome, wfns.txt, quiet = TRUE)
r$thresholds
# very low, low, medium, high, very high, Inf
# Levels: very low < low < medium < high < very high < Inf

coords(r, "medium")
#   threshold specificity sensitivity
# 1    medium   0.7916667   0.6585365
This is a breaking change for any code that reads roc$thresholds as numbers,
or passes a numeric cut-off into coords(), ci.thresholds(), ci.coords(),
or plot.roc(print.thres = ...) on an ordered ROC curve. Numeric predictors are entirely
unaffected by this change. Where you used to pass a midpoint, pass the level label instead:
# Incorrect (pROC <= 1.19.1 converted wfns to 1:5, thresholds were midpoints):
coords(roc(aSAH$outcome, aSAH$wfns), 2.5)

# Correct: pass the level label
coords(roc(aSAH$outcome, aSAH$wfns, quiet = TRUE), "3")
The mapping from old midpoints to new labels is straightforward (for direction = "<",
the default): the old -Inf becomes the lowest level, the old midpoint k + 0.5
becomes the level in position k + 1, and the old Inf becomes the level literally
named "Inf".
As a side effect of the same fix, ci.coords(..., x = "best", best.policy = "omit") now
correctly drops a bootstrap replicate that has several equally-good "best" points, instead of
silently keeping the first one.
How to test it
This is not released yet: it is only on the develop branch, ahead of the
next CRAN release, planned for early 2027. If you use ordered predictors with roc(), please
install the development version and run your own code against it:
if (! requireNamespace("devtools")) install.packages("devtools")
devtools::install_github("xrobin/pROC@develop")
Recommendations
If you have scripts or packages that build ROC curves from ordered predictors, please run them against
the develop version and check the following:
- Any place you hard-code a numeric threshold for an ordered predictor (in
coords(),ci.thresholds(),ci.coords(), orprint.thres) will need to switch to the level label. roc()now requirescasesandcontrolsbuilt from ordered vectors to have identical levels; it errors instead of silently coercing when they differ (for example after an unbalanceddroplevels()).- Smoothing an ordered ROC curve now only supports
method = "binormal"; other smoothing methods error instead of silently falling back to a numeric conversion. - AUC, DeLong and bootstrap CIs,
roc.test(),cov()/var(), andpower.roc.test()all still match what you got before. Only the thresholds changed, not the statistics.
If anything looks off, please comment on issue #63 or open a new issue on GitHub before this reaches CRAN. Thanks in advance for testing!
Xavier Robin
Published Tuesday, October 6, 2026 14:26 CEST
Permalink: /blog/2026/10/06/breaking-changes-for-ordered-predictors-in-upcoming-proc-1.20.0
Tags:
pROC
Comments: 0
pROC 1.19.1
pROC 1.19.1 is a minor maintenance release. The only user-facing change is the introduction of a FAQ vignette which supersedes the old wiki.
Here is the full changelog:
- Added a FAQ vignette
- Removed unused
tcltkfrom Suggests - Tests now skip if Suggest'ed packages are missing
- Fix CRAN checks NOTE about
structure()special names (.Names,.Dim,.Dimnames)
Xavier Robin
Published Thursday, August 27, 2026 13:10 CEST
Permalink: /blog/2026/08/27/proc-1.19.1
Tags:
pROC
Comments: 0
pROC 1.19.0
pROC version 1.19.0 was just released and will be available on CRAN very soon.
Besides minor changes and fixes in the coords and ci.coords functions,
the main updates in this version focus on the core of the package, aiming to make it more modern, efficient, and easier
to maintain. Several features that were difficult to maintain have been deprecated.
- The dependency on the retired plyr package has been removed (thanks to Michael Chirico for his contributions).
Unfortunately, as a side effect, progress bars and parallel processing have been removed.
Trying to set the
progressandparallelarguments will now trigger a warning, and the arguments will be ignored. - As a followup from the changes to the output of the
coordsfunction in version 1.16.0, thetranspose,as.list,as.matrixanddroparguments have been deprecated. Thecoordsfunction currently has multiple exit points, depending on arguments and inputs, and can return retults in mutliple formats. This makes it difficult to use and to maintain. Going forward,coordswill only retrun data in a single, tidydata.frameformat, compatible following modern R coding practices. For compatibility reasons, deprecated arguments are still available, but setting them to non default values will trigger warnings. They will be removed in a future release. If your code still uses these arguments, please update it accordingly. - Finally, following years of performance improvements, an in an effort to simplify the codebase, all ROC computation
algorithms other than 2 have been removed as they no longer provided meaningful performance advantages. The
algorithmargument torochas been deprecated. Setting it to a non-default value has no effect and triggers a warning. Thefun.sespvalue ofrocobjects is also deprecated. Calling it triggers a warning. Both will be removed in a future release of pROC.
Here is the full changelog:
ci.coordscan now take the sameinputvalues ascoords(issue #90)ci.coordscan beplotted- Added "lr_pos" and "lr_neg" to
coords(issue #102) coordswith partial.auc now interpolates bounds when needed- Added
ignore.partial.aucargument tocoords - Deprecated
transpose,as.list,as.matrixanddropincoords - Deprecated the
algorithmargument torocandfun.sespvalue - Deprecated the
progressandparallelargument for bootstrap operations. - Removed dependencies on doParallel and retired package plyr (thanks to Michael Chirico, pr #134, #135, #136, #137, #138, #139 and #140).
You can update your installation by simply typing:
install.packages("pROC")
Update: pROC 1.19.0 was rejected from CRAN. A patch revision 1.19.0.1 was created to workaround an issue with a reverse dependency but provides no meaningful change:
- Move
fun.sespdefinition to work around LudvigOlsen/cvms#44.
Xavier Robin
Published Wednesday, July 30, 2025 18:56 CEST
Permalink: /blog/2025/07/30/proc-1.19.0
Tags:
pROC
Comments: 0
pROC 1.18.5
pROC 1.18.5 is now available on CRAN. It's a minor bugfix release:
- Fixed formula input when given as variable and combined with
with(issue #111) - Fixed formula containing variables with spaces (issue #120)
- Fixed broken grouping when
colourargument was given inggroc(issue #121)
You can update your installation by simply typing:
install.packages("pROC")Xavier Robin
Published Thursday, November 2, 2023 17:01 CET
Permalink: /blog/2023/11/02/proc-1.18.5
Tags:
pROC
Comments: 0
Deep Learning of MNIST handwritten digits
In this document I am going create a video showing the training of the inner-most layer of Deep Belief Network (DBN) using the MNIST dataset of handwritten digits. I will use our DeepLearning R package that implements flexible DBN architectures with an object-oriented interface.
MNIST
The MNIST dataset is a database of handwritten digits with 60,000 training images and 10,000 testing images. You can learn everything about it on Wikipedia. In short, it is the go-to dataset to train and test handwritten digit recognition machine learning algorithms.
I made an R package for easy access, named mnist. The easiest way to install it is with devtools. If you don't have it already, let's first install devtools:
if (!require("devtools")) {install.packages("devtools")}
Now we can install mnist:
devtools::install_github("xrobin/mnist")
PCA
In order to see what the dataset looks like, let's use PCA to reduce it to two dimensions.
pca <- prcomp(mnist$train$x)
plot.mnist(
	prediction = predict(pca, mnist$test$x),
	reconstruction = tcrossprod(
		predict(pca, mnist$test$x)[,1:2], pca$rotation[,1:2]),
	highlight.digits = c(72, 3, 83, 91, 6688, 7860, 92, 1, 180, 13))
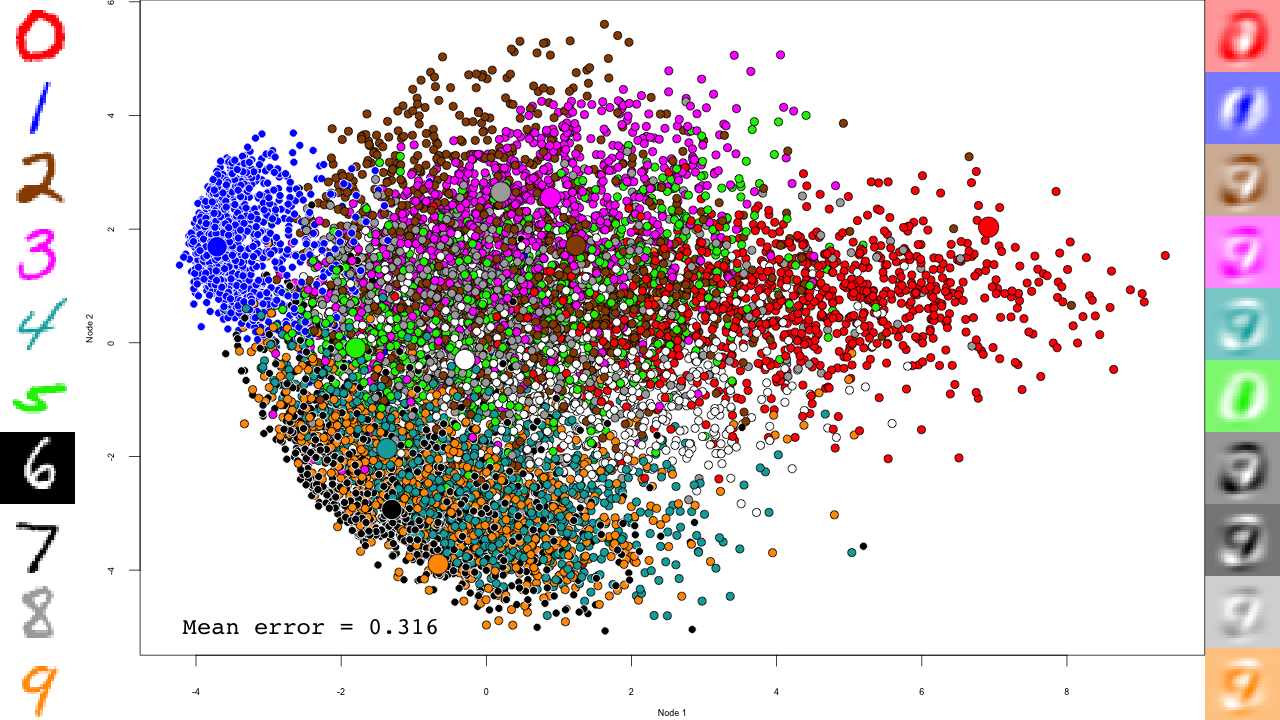
Let's take a minute to describe this plot. The central scatterplot shows first two components of the PCA of all digits in the test set. On the left hand side, I picked 10 representative digits from the test set to highlight, which are shown as larger circles in the central scatterplot. On the left are the "reconstructed digits", which were reconstructed from the two first dimensions of the PCA. While we can see some digit-like structures, it is basically impossible to recognize them. We can see some separation of the digits in the 2D space as well, but it is pretty weak and some pairs cannot be distinguished at all (like 4 and 9). Of course the reconstructions would look much better had we kept all PCA dimensions, but so much for dimensionality reduction.
Deep Learning
Now let's see if we can do better with Deep Learning. We'll use a classical Deep Belief Network (DBN), based on Restricted Boltzmann Machines (RBM) similar to what Hinton described back in 2006 (Hinton & Salakhutdinov, 2006). The training happens in two steps: a pre-training step with contrastive divergence stochastic gradient descent brings the network to a reasonable starting point for a more conventional conjugate gradient optimization (hereafter referred to as fine-tuning).
I implemented this algorithm with a few modifications in an R package which is available on GitHub. The core of the processing is done in C++ with RcppEigen (Bates & Eddelbuettel, 2013) for higher speed. Using devtools again:
devtools::install_github("xrobin/DeepLearning")
We will use this code to train a 5 layers deep network, that reduces the digits to an abstract, 2D representation. By looking at this last layer throughout the training process we can start to understand how the network learns to recognize digits. Let's start by loading the required packages and the MNIST dataset, and create the DBN.
library(DeepLearning)
library(mnist)
data(mnist)

dbn <- DeepBeliefNet(Layers(c(784, 1000, 500, 250, 2),
	input = "continuous", output = "gaussian"),
	initialize = "0")
We just created the 5-layers DBN, with continuous, 784 nodes input (the digit image pixels), and a 2 nodes, gaussian output. It is initialized with 0, but we could have left out the initialize to start from a random initilization (Bengio et al., 2007). Before we go, let's define a few useful variables:
output.folder <- "video" # Where to save the output
maxiters.pretrain <- 1e6  # Number of pre-training iterations
maxiters.train <- 10000 # Number of fine-tuning iterations
run.training <- run.images <- TRUE # Turn any of these off
# Which digits to highlight and reconstruct
highlight.digits = c(72, 3, 83, 91, 6688, 7860, 92, 1, 180, 13)
We'll also need the following function to show the elapsed time:
format.timediff <- function(start.time) {
    diff = as.numeric(difftime(Sys.time(), start.time, units="mins"))
    hr <- diff%/%60
    min <- floor(diff - hr * 60)
    sec <- round(diff%%1 * 60,digits=2)
    return(paste(hr,min,sec,sep=':'))
}
Pre-training
Initially, the network is a stack of RBMs that we need to pre-train one by one. Hinton & Salakhutdinov (2006) showed that this step is critical to train deep networks. We will use 1000000 iterations (maxiters.pretrain) of contrastive divergence, which takes a couple of days on a modern CPU. Let's start with the first three RBMs:
First three RBMs
if (run.training) {
	sprintf.fmt.iter <- sprintf("%%0%dd", nchar(sprintf("%d", maxiters.pretrain)))

	mnist.data.layer <- mnist
	for (i in 1:3) {
We define a diag function that will simply print where we are in the training. Because this function will be called a million times (maxiters.pretrain), we can use rate = "accelerate" to slow down the printing over time and save a few CPU cycles.
		diag <- list(rate = "accelerate", data = NULL, f = function(rbm, batch, data, iter, batchsize, maxiters, layer) {
			print(sprintf("%s[%s/%s] in %s", layer, iter, maxiters, format.timediff(start.time)))
		})
We can get the current RBM, and we will work on it directly. Let's save it for good measure, as well as the current time for the progress function:
		rbm <- dbn[[i]]
		save(rbm, file = file.path(output.folder, sprintf("rbm-%s-%s.RData", i, "initial")))
		start.time <- Sys.time()
Now we can start the actual pre-training:
		rbm <- pretrain(rbm, mnist.data.layer$train$x,
			penalization = "l2", lambda=0.0002, momentum = c(0.5, 0.9),
			epsilon=c(.1, .1, .1, .001)[i], batchsize = 100, maxiters=maxiters.pretrain,
			continue.function = continue.function.always, diag = diag)
This can take some time, especially for the first layers which are larger. Once it is done, we predict the data through this RBM for the next layer and save the results:
		mnist.data.layer$train$x <- predict(rbm, mnist.data.layer$train$x)
		mnist.data.layer$test$x <- predict(rbm, mnist.data.layer$test$x)
		save(rbm, file = file.path(output.folder, sprintf("rbm-%s-%s.RData", i, "final")))
		dbn[[i]] <- rbm
	}
Last RBM
This is very similar to the previous three, but note that we save the RBM within the diag function. We could generate the plot directly, but it is easier to do it later once we have some idea about the final axis we will need. Please note the rate = "accelerate" here. You probably don't want to save a million RBM objects on your hard drive, both for speed and space reasons.
	rbm <- dbn[[4]]
	print(head(rbm$b))
	diag <- list(rate = "accelerate", data = NULL, f = function(rbm, batch, data, iter, batchsize, maxiters, layer) {
		save(rbm, file = file.path(output.folder, sprintf("rbm-4-%s.RData", sprintf(sprintf.fmt.iter, iter))))
		print(sprintf("%s[%s/%s] in %s", layer, iter, maxiters, format.timediff(start.time)))
	})
	save(rbm, file = file.path(output.folder, sprintf("rbm-%s-%s.RData", 4, "initial")))
	start.time <- Sys.time()
	rbm <- pretrain(rbm, mnist.data.layer$train$x,  penalization = "l2", lambda=0.0002,
		epsilon=.001, batchsize = 100, maxiters=maxiters.pretrain,
		continue.function = continue.function.always, diag = diag)
	save(rbm, file = file.path(output.folder, sprintf("rbm-4-%s.RData", "final")))
	dbn[[4]] <- rbm
If we were not querying the last layer, we could have pre-trained the entire network at once with the following call:
	dbn <- pretrain(dbn, mnist.data.layer$train$x,
		penalization = "l2", lambda=0.0002, momentum = c(0.5, 0.9),
		epsilon=c(.1, .1, .1, .001), batchsize = 100,
		maxiters=maxiters.pretrain,
		continue.function = continue.function.always)
Pre-training parameters
Pre-training RBMs is quite sensitive to the use of proper parameters. With improper parameters, the network can quickly go crazy and start to generate infinite values. If that happens to you, you should try to tune one of the following parameters:
penalization: this is the penalty of introducing or increasing the value of a weight. We used L2 regularization, but"l1"is available if a sparser weight matrix is needed.lambda: the regularization rate. In our experience 0.0002 works fine with the MNIST and other datasets of similar sizes such as cellular imaging data. Too small or large values will result in over- or under-fitted networks, respectively.momentum: helps avoiding oscillatory behaviors, where the network oscillate between iterations. Allowed values can range from 0 (no momentum) to 1 (full momentum = no training). Here we used an increasing gradient of momentum which starts at 0.5 and increases linearly to 0.9, in order to stabilize the final network without compromising early training steps.epsilon: the learning rate. Typically, 0.1 works well with binary and continuous output layers, and must be decreased to around 0.001 for gaussian outputs. Too large values will drive the network to generate infinities, while too small ones will slow down the training.batchsize: larger batch sizes will result in smoother but slower training. Small batch sizes will make the training "jumpy", which can be compensated by lower learning rates (epsilon) or increased momentum.
Fine-tuning
This is where the real training happens. We use conjugate gradients to find the optimal solution. Again, the diag function saves the DBN. This time we use rate = "each" to save every step of the training. First we have way fewer steps, but also the training itself happen at a much more stable speed than in the pre-training, where things slow down dramatically.
	sprintf.fmt.iter <- sprintf("%%0%dd", nchar(sprintf("%d", maxiters.train)))
	diag <- list(rate = "each", data = NULL, f = function(dbn, batch, data, iter, batchsize, maxiters) {
		save(dbn, file = file.path(output.folder, sprintf("dbn-finetune-%s.RData", sprintf(sprintf.fmt.iter, iter))))
		print(sprintf("[%s/%s] in %s", iter, maxiters, format.timediff(start.time)))
	})
	save(dbn, file = file.path(output.folder, sprintf("dbn-finetune-%s.RData", "initial")))
	start.time <- Sys.time()
	dbn <- train(unroll(dbn), mnist$train$x, batchsize = 100, maxiters=maxiters.train,
		continue.function = continue.function.always, diag = diag)
	save(dbn, file = file.path(output.folder, sprintf("dbn-finetune-%s.RData", "final")))
}
And that's it, our DBN is now fully trained!
Generating the images
Now we need to read in the saved network states again, pass the data through the network (predict) and save this in HD-sized PNG file.
The first three RBMs are only loaded into the DBN
if (run.images) {
	for (i in 1:3) {
		load(file.path(output.folder, sprintf("rbm-%d-final.RData", i)))
		dbn[[i]] <- rbm
	}
The last RBM is where interesting things happen.
	for (file in list.files(output.folder, pattern = "rbm-4-.+\\.RData", full.names = TRUE)) {
		print(file)
		load(file)
		dbn[[4]] <- rbm
		iter <- stringr::str_match(file, "rbm-4-(.+)\\.RData")[,2]
We now predict and reconstruct the data, and calculate the mean reconstruction error:
		predictions <- predict(dbn, mnist$test$x)
		reconstructions <- reconstruct(dbn, mnist$test$x)
		iteration.error <- errorSum(dbn, mnist$test$x) / nrow(mnist$test$x)
Now the actual plotting. Here I selected xlim and ylim values that worked well for my training run, but your mileage may vary.
		png(sub(".RData", ".png", file), width = 1280, height = 720) # hd output
		plot.mnist(model = dbn, x = mnist$test$x, label = mnist$test$y+1, predictions = predictions, reconstructions = reconstructions,
				   ncol = 16, highlight.digits = highlight.digits,
				   xlim = c(-12.625948, 8.329168), ylim = c(-10.50657, 13.12654))
		par(family="mono")
		legend("bottomleft", legend = sprintf("Mean error = %.3f", iteration.error), bty="n", cex=3)
		legend("bottomright", legend = sprintf("Iteration = %s", iter), bty="n", cex=3)
		dev.off()
	}
We do the same with the fine-tuning:
	for (file in list.files(output.folder, pattern = "dbn-finetune-.+\\.RData", full.names = TRUE)) {
		print(file)
		load(file)
		iter <- stringr::str_match(file, "dbn-finetune-(.+)\\.RData")[,2]
		predictions <- predict(dbn, mnist$test$x)
		reconstructions <- reconstruct(dbn, mnist$test$x)
		iteration.error <- errorSum(dbn, mnist$test$x) / nrow(mnist$test$x)
		png(sub(".RData", ".png", file), width = 1280, height = 720) # hd output
		plot.mnist(model = dbn, x = mnist$test$x, label = mnist$test$y+1, predictions = predictions, reconstructions = reconstructions,
				   ncol = 16, highlight.digits = highlight.digits,
				   xlim = c(-22.81098,  27.94829), ylim = c(-17.49874,  33.34688))
		par(family="mono")
		legend("bottomleft", legend = sprintf("Mean error = %.3f", iteration.error), bty="n", cex=3)
		legend("bottomright", legend = sprintf("Iteration = %s", iter), bty="n", cex=3)
		dev.off()
	}
}
The video
I simply used ffmpeg to convert the PNG files to a video:
cd video
ffmpeg -pattern_type glob -i "rbm-4-*.png" -b:v 10000000 -y ../rbm-4.mp4
ffmpeg -pattern_type glob -i "dbn-finetune-*.png" -b:v 10000000 -y ../dbn-finetune.mp4
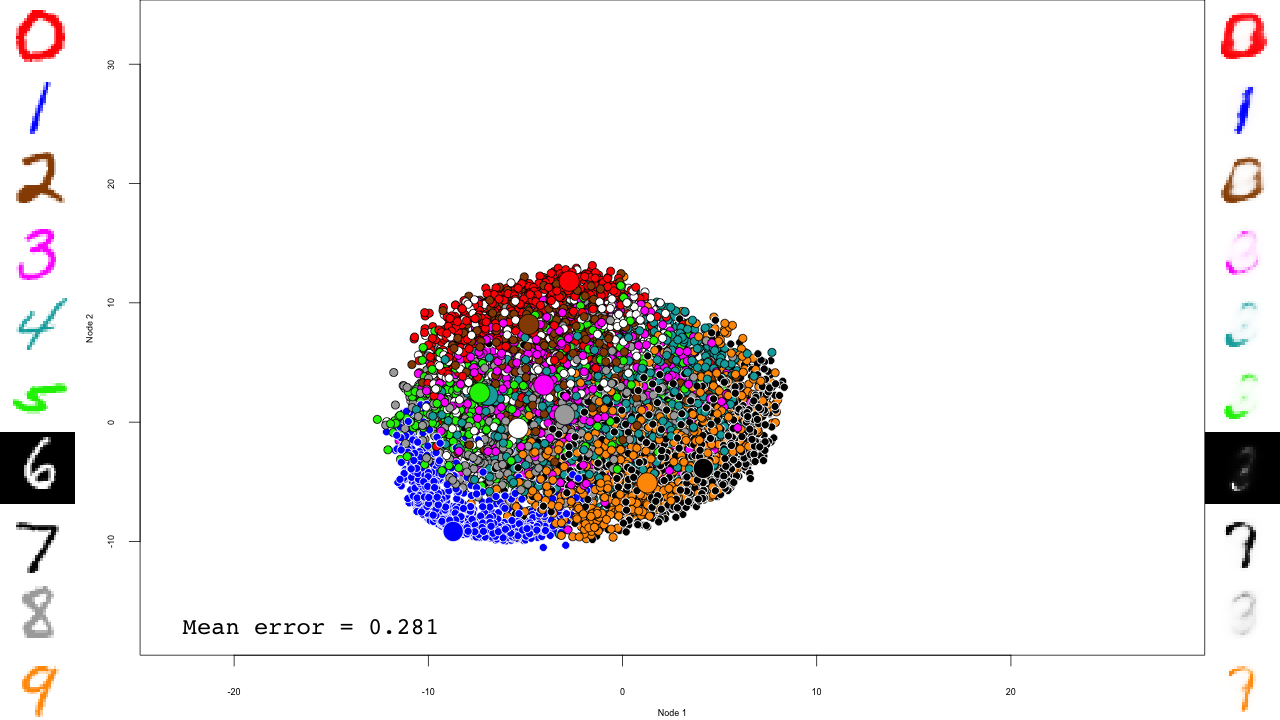
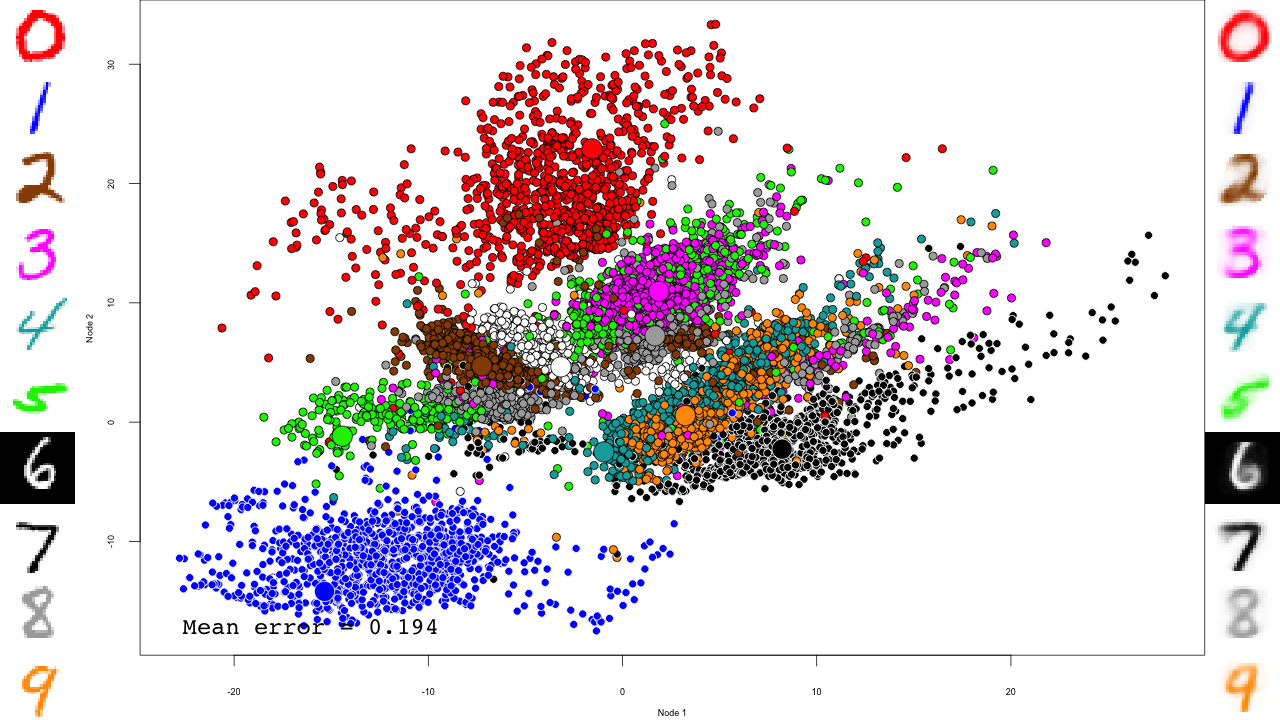
And that's it! Notice how the pre-training only brings the network to a state similar to that of a PCA, and the fine-tuning actually does the separation, and how it really makes the reconstructions accurate.
Application
We used this code to analyze changes in cell morphology upon drug resistance in cancer. With a 27-dimension space, we could describe all of the observed cell morphologies and predict whether a cell was resistant to ErbB-family drugs with an accuracy of 74%. The paper is available in Open Access in Cell Reports, DOI 10.1016/j.celrep.2020.108657.
Concluding remarks
In this document I described how to build and train a DBN with the DeepLearning package. I also showed how to query the internal layer, and use the generative properties to follow the training of the network on handwritten digits.
DBNs have the advantage over Convolutional Networks (CN) that they are fully generative, at least during the pre-training. They are therefore easier to query and interpret as we have demonstrated here. However keep in mind that CNs have demonstrated higher accuracies on computer vision tasks, such as the MNIST dataset.
Additional algorithmic details are available in the doc folder of the DeepLearning package.
References
- Our paper, 2021
- Longden J., Robin X., Engel M., et al. Deep neural networks identify signaling mechanisms of ErbB-family drug resistance from a continuous cell morphology space. Cell Reports, 2021;34(3):108657.
- Bates & Eddelbuettel, 2013
- Bates D, Eddelbuettel D. Fast and Elegant Numerical Linear Algebra Using the RcppEigen Package. Journal of Statistical Software, 2013;52(5):1–24.
- Bengio et al., 2007
- Bengio Y, Lamblin P, Popovici D, Larochelle H. Greedy layer-wise training of deep networks. Advances in neural information processing systems. 2007;19:153–60.
- Hinton & Salakhutdinov, 2006
- Hinton GE, Salakhutdinov RR. Reducing the Dimensionality of Data with Neural Networks. Science. 2006;313(5786):504–7.
Downloads
Xavier Robin
Published Saturday, June 11, 2022 16:39 CEST
Permalink: /blog/2022/06/11/deep-learning-of-mnist-handwritten-digits
Tags:
Programming
Comments: 0
pROC 1.18.0
pROC version 1.18.0 is now available on CRAN now. Only a few changes were implemented in this release:
- Add CI of the estimate for
roc.test(DeLong, paired only for now) (code contributed by Zane Billings) (issue #95). - Fix documentation and alternative hypothesis for Venkatraman test (issue #92).
You can update your installation by simply typing:
install.packages("pROC")Xavier Robin
Published Monday, September 6, 2021 18:34 CEST
Permalink: /blog/2021/09/06/proc-1.18.0
Tags:
pROC
Comments: 2
pROC 1.17.0.1
pROC version 1.17.0.1 is available on CRAN now. Besides several bug fixes and small changes, it introduces more values in input of coords.
Here is an example:
library(pROC)
data(aSAH)
rocobj <- roc(aSAH$outcome, aSAH$s100b)
coords(rocobj, x = seq(0, 1, .1), input="recall", ret="precision")
#    precision
# 1        NaN
# 2  1.0000000
# 3  1.0000000
# 4  0.8601399
# 5  0.6721311
# 6  0.6307692
# 7  0.6373057
# 8  0.4803347
# 9  0.4517906
# 10 0.3997833
# 11 0.3628319
Getting the update
The update his available on CRAN now. You can update your installation by simply typing:
install.packages("pROC")
Here is the full changelog:
1.17.0.1 (2020-01-07):
- Fix CRAN incoming checks as requested by CRAN.
1.17.0 (2020-12-29)
- Accept more values in
inputofcoords(issue #67). - Accept
kappafor thepower.roc.testof two ROC curves (issue #82). - The
inputargument tocoordsforsmooth.roccurves no longer has a default. - The
xargument tocoordsforsmooth.roccan now be set toall(also the default). - Fix bootstrap
roc.testandcovwithsmooth.roccurves. - The
ggrocfunction can now plotsmooth.roccurves (issue #86). - Remove warnings with
warnPartialMatchDollaroption (issue #87). - Make tests depending on vdiffr conditional (issue #88).
Xavier Robin
Published Wednesday, January 13, 2021 16:19 CET
Permalink: /blog/2021/01/13/proc-1.17.0.1
Tags:
pROC
Comments: 2
pROC 1.16.1
pROC version 1.16.1 is a minor release that disables a timing-dependent test based on the microbenchmark package that can sometimes cause random failures on CRAN. This version contains no user-visible changes. Users don't need to install this update.
Xavier Robin
Published Tuesday, January 14, 2020 08:52 CET
Permalink: /blog/2020/01/14/proc-1.16.1
Tags:
pROC
Comments: 0
pROC 1.16.0
pROC version 1.16.0 is available on CRAN now. Besides several bug fixes, the main change is the switch of the default value of the transpose argument to the coords function from TRUE to FALSE. As announced earlier, this is a backward incompatible change that will break any script that did not previously set the transpose argument and for now comes with a warning to make debugging easier. Scripts that set transpose explicitly are not unaffected.
New return values of coords and ci.coords
With transpose = FALSE, the coords returns a tidy data.frame suitable for use in pipelines:
data(aSAH)
rocobj <- roc(aSAH$outcome, aSAH$s100b)
coords(rocobj, c(0.05, 0.2, 0.5), transpose = FALSE)
#      threshold specificity sensitivity
# 0.05      0.05  0.06944444   0.9756098
# 0.2       0.20  0.80555556   0.6341463
# 0.5       0.50  0.97222222   0.2926829
The function doesn't drop dimensions, so the result is always a data.frame, even if it has only one row and/or one column.
If speed is of utmost importance, you can get the results as a non-transposed matrix instead:
coords(rocobj, c(0.05, 0.2, 0.5), transpose = FALSE, as.matrix = TRUE)
#      threshold specificity sensitivity
# [1,]      0.05  0.06944444   0.9756098
# [2,]      0.20  0.80555556   0.6341463
# [3,]      0.50  0.97222222   0.2926829
In some scenarios this can be a tiny bit faster, and is used internally in ci.coords.
Type help(coords_transpose) for additional information.
ci.coords
The ci.coords function now returns a list-like object:
ciobj <- ci.coords(rocobj, c(0.05, 0.2, 0.5))
ciobj$accuracy
#        2.5%       50%     97.5%
# 1 0.3628319 0.3982301 0.4424779
# 2 0.6637168 0.7433628 0.8141593
# 3 0.6725664 0.7256637 0.7787611
The print function prints a table with all the results, however this table is generated on the fly and not available directly.
ciobj
# 95% CI (2000 stratified bootstrap replicates):
#      threshold sensitivity.low sensitivity.median sensitivity.high
# 0.05      0.05          0.9268             0.9756           1.0000
# 0.2       0.20          0.4878             0.6341           0.7805
# 0.5       0.50          0.1707             0.2927           0.4390
#      specificity.low specificity.median specificity.high accuracy.low
# 0.05         0.01389            0.06944           0.1250       0.3628
# 0.2          0.70830            0.80560           0.8889       0.6637
# 0.5          0.93060            0.97220           1.0000       0.6726
#      accuracy.median accuracy.high
# 0.05          0.3982        0.4425
# 0.2           0.7434        0.8142
# 0.5           0.7257        0.7788
The following code snippet can be used to obtain all the information calculated by the function:
for (ret in attr(ciobj, "ret")) {
	print(ciobj[[ret]])
}
#        2.5%       50%     97.5%
# 1 0.9268293 0.9756098 1.0000000
# 2 0.4878049 0.6341463 0.7804878
# 3 0.1707317 0.2926829 0.4390244
#         2.5%        50%     97.5%
# 1 0.01388889 0.06944444 0.1250000
# 2 0.70833333 0.80555556 0.8888889
# 3 0.93055556 0.97222222 1.0000000
#        2.5%       50%     97.5%
# 1 0.3628319 0.3982301 0.4424779
# 2 0.6637168 0.7433628 0.8141593
# 3 0.6725664 0.7256637 0.7787611
Getting the update
The update his available on CRAN now. You can update your installation by simply typing:
install.packages("pROC")
Here is the full changelog:
- BACKWARD INCOMPATIBLE CHANGE:
transposeargument tocoordsswitched toFALSEby default (issue #54). - BACKWARD INCOMPATIBLE CHANGE:
ci.coordsreturn value is now of list type and easier to use. - Fix one-sided DeLong test for curves with
direction=">"(issue #64). - Fix an error in
ci.coordsdue to expectedNAvalues in some coords (like "precision") (issue #65). - Ordrered predictors are converted to numeric in a more robust way (issue #63).
- Cleaned up
power.roc.testcode (issue #50). - Fix pairing with
roc.formulaand warn ifna.actionis not set to"na.pass"or"na.fail"(issue #68). - Fix
ci.coordsnot working withsmooth.roccurves.
Xavier Robin
Published Sunday, January 12, 2020 21:46 CET
Permalink: /blog/2020/01/12/proc-1.16.0
Tags:
pROC
Comments: 0
 Search
 Tags
 Recent posts
 Calendar
 Syndication